Profiling torch.compile()
For this example, we’ll define yet another simple function. We’ll use the taylor series expansion of sin(x). We choose this in particular for 2 reasons.
- To show
torch.compilecan generate C++/CUDA code for a variety of functions not just neural network models - You can grow this function to be arbtrarily large by simply adding more terms to the series expansion
import torch
import math
import os
import matplotlib.pyplot as plt
from torch import optim
import torch._dynamo
from torchvision import models
from torch.profiler import profile, record_function, ProfilerActivity

pi = math.pi
device = torch.device("cuda") if torch.cuda.is_available() else "cpu"
Define our sin(x) taylor series expansion
def sin_taylor(x,n,device):
    sinx=0.
    factorial = lambda d: torch.lgamma(torch.tensor(d+1,device=device)).exp()
    for i in range(n):
        sinx += ((-1.)**i)*(x**(1+2*i))/factorial(2*i+1)
    return sinx
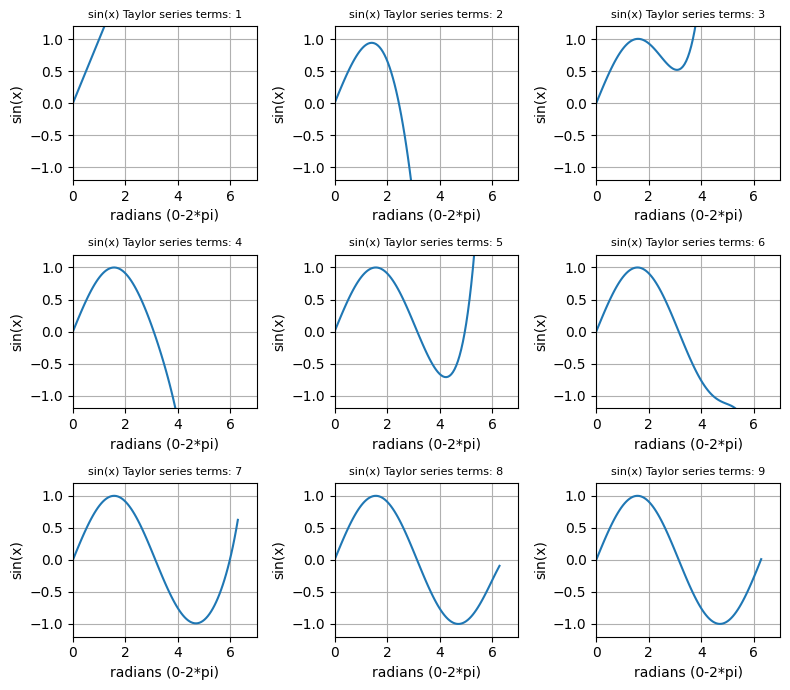
Visualize the output
import matplotlib.pyplot as plt
fig, ax = plt.subplots(3,3,figsize=(8,7))
rads = torch.linspace(0,2*pi,100)
ax=[b for a in ax for b in a]

counter=0
for i in range(1,10):
    sinx = lambda x: sin_taylor(x,i,device)
    ax[counter].plot(rads,sinx(rads.to(device)).cpu(),label=i)
    ax[counter].set_title(f'sin(x) Taylor series terms: {i}')
    ax[counter].set_xlabel('radians (0-2*pi)')
    ax[counter].set_ylabel('sin(x)')
    ax[counter].set_ylim([-1.2, 1.2])
    ax[counter].set_xlim([0,7])
    ax[counter].title.set_fontsize(8)
    ax[counter].grid()
    counter+=1
fig.tight_layout()
Output: You can see that the wave starts to resemble a sin wave after adding 9 terms.
torch.manual_seed(0)
x = torch.rand(10000000, requires_grad=True).to(device)

n=10
model = lambda x: sin_taylor(x,n,device)

%time out = model(x).sum().backward()
Compile model with debug mode enabled
torch._dynamo.reset()
compiled_model = torch.compile(model,options={'trace.enabled':True, 'trace.graph_diagram':True})
out = compiled_model(x).sum().backward()
Profile uncompiled code!
from torch.profiler import profile, record_function, ProfilerActivity
with profile(activities=[ProfilerActivity.CUDA,ProfilerActivity.CPU]) as prof:
    out = model(x).sum().backward()

print(prof.key_averages(group_by_stack_n=5).table(sort_by="self_cuda_time_total", row_limit=5))

prof.export_chrome_trace("no_compile_trace.json")
-------------------------------------------------------  ------------  ------------  ------------  ------------  ------------  ------------  ------------  ------------  ------------  ------------
                                                   Name    Self CPU %      Self CPU   CPU total %     CPU total  CPU time avg     Self CUDA   Self CUDA %    CUDA total  CUDA time avg    # of Calls
-------------------------------------------------------  ------------  ------------  ------------  ------------  ------------  ------------  ------------  ------------  ------------  ------------
                                       cudaLaunchKernel         1.35%     450.000us         1.35%     450.000us       4.091us      12.766ms        49.45%      12.766ms     116.055us           110
                                            aten::copy_         0.23%      78.000us        72.46%      24.196ms       2.016ms      11.268ms        43.65%      11.404ms     950.333us            12
                       Memcpy DtoH (Device -> Pageable)         0.00%       0.000us         0.00%       0.000us       0.000us      11.117ms        43.06%      11.117ms      11.117ms             1
                                              aten::mul         0.91%     303.000us         1.36%     455.000us      11.375us       6.036ms        23.38%       6.378ms     159.450us            40
void at::native::vectorized_elementwise_kernel<4, at...         0.00%       0.000us         0.00%       0.000us       0.000us       4.067ms        15.75%       4.067ms     135.567us            30
-------------------------------------------------------  ------------  ------------  ------------  ------------  ------------  ------------  ------------  ------------  ------------  ------------
Self CPU time total: 33.393ms
Self CUDA time total: 25.816ms
Profile compiled code!
torch._dynamo.reset()
compiled_model = torch.compile(model,options={'trace.enabled':True, 'trace.graph_diagram':True})
out = compiled_model(x)
[2023-03-30 18:28:24,754] torch._inductor.debug: [WARNING] model__1_forward_4 debug trace: /pytorch-examples/pytorch2-workshop-examples/torch_compile_debug/run_2023_03_30_18_28_23_632206-pid_5849/aot_torchinductor/model__1_forward_4.2


Writing FX graph to file: /pytorch-examples/pytorch2-workshop-examples/torch_compile_debug/run_2023_03_30_18_28_23_632206-pid_5849/aot_torchinductor/model__1_forward_4.2/graph_diagram.svg
from torch.profiler import profile, record_function, ProfilerActivity
with profile(activities=[ProfilerActivity.CUDA, ProfilerActivity.CPU],
            ) as prof:
    out = compiled_model(x)

print(prof.key_averages(group_by_stack_n=5).table(sort_by="self_cuda_time_total", row_limit=-1))

prof.export_chrome_trace("compiled_trace.json")
------------------------- ------------ ------------ ------------ ------------ ------------ ------------ ------------ ------------ ------------ ------------
Name Self CPU % Self CPU CPU total % CPU total CPU time avg Self CUDA Self CUDA % CUDA total CUDA time avg # of Calls
------------------------- ------------ ------------ ------------ ------------ ------------ ------------ ------------ ------------ ------------ ------------
triton__0d1d2d 0.00% 0.000us 0.00% 0.000us 0.000us 139.000us 100.00% 139.000us 139.000us 1
cudaDeviceSynchronize 100.00% 7.000us 100.00% 7.000us 7.000us 0.000us 0.00% 0.000us 0.000us 1
------------------------- ------------ ------------ ------------ ------------ ------------ ------------ ------------ ------------ ------------ ------------
Self CPU time total: 7.000us
Self CUDA time total: 139.000us
STAGE:2023-03-30 18:28:24 5849:5849 ActivityProfilerController.cpp:311] Completed Stage: Warm Up
STAGE:2023-03-30 18:28:24 5849:5849 ActivityProfilerController.cpp:317] Completed Stage: Collection
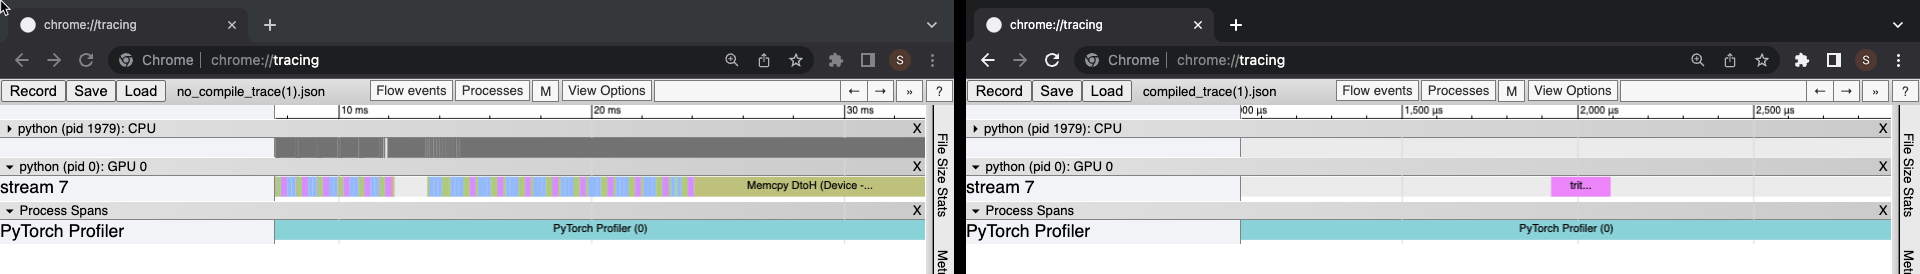
STAGE:2023-03-30 18:28:24 5849:5849 ActivityProfilerController.cpp:321] Completed Stage: Post Processing
Tracing output